
Building InterSystems IRIS Applications with Familiar Python Tools
Once you are comfortable querying InterSystems IRIS® data platform using SQL, you can start building interactive applications that work with your data. This section introduces how to build simple apps using familiar Python tools such as Jupyter Notebooks, Streamlit, and Flask.
These tools are widely used in the Python ecosystem and integrate well with InterSystems IRIS, allowing you to:
-
Explore and visualize data from InterSystems IRIS interactively.
-
Build web applications and dashboards.
-
Expose InterSystems IRIS data via RESTful APIs.
Interactive Exploration with Jupyter Notebooks
Jupyter Notebooks are interactive coding environments often used for data science, machine learning, and teaching. They combine code, visualization, and markdown-based documentation in a single browser-based interface. With your notebooks, you can connect to InterSystems IRIS and analyze data using standard Python libraries such as pandas, matplotlib, and more. Using Jupyter Notebooks with InterSystems IRIS is no different than using any other database. Watch Using Embedded Python as a Jupyter Notebook ServerOpens in a new tab to see an example of this integration.
Building Interactive Apps with Streamlit and InterSystems IRIS
StreamlitOpens in a new tab is a Python framework that allows developers to build interactive web applications with minimal code. You do not need to know HTML, CSS, or JavaScript. When paired with InterSystems IRIS and SQLAlchemy, it becomes a powerful tool for creating data-driven dashboards, query interfaces, and lightweight front ends.
This section walks through a complete Streamlit application that connects to InterSystems IRIS, runs SQL queries, visualizes data, and uploads CSV files into the database.
Prerequisites
Before you begin, install streamlit in addition to the setup from before:
pip install streamlit
This particular application uses Pandas to help parse data more easily and Plotly Express to create interactive visualizations. Make sure to install them as well for this application:
pip install pandas plotly
You should also have access to a running InterSystems IRIS instance and valid connection credentials (host, port, username, password, namespace).
Building Your First Streamlit InterSystems IRIS App
In this section, you will build a fully functional Streamlit application that connects to InterSystems IRIS to query data, create visualizations, and even allow to file uploads to update your InterSystems IRIS database—all using Python.
You will create a lightweight, interactive web interface where users can:
-
Connect to an InterSystems IRIS database and run custom SQL queries.
-
View query results in an interactive table.
-
Download results as CSV files.
-
Visualize numeric data with Plotly charts.
-
Upload CSV files and insert their contents into existing InterSystems IRIS tables.
This app is great for data analysts, data engineers, or developers who want a quick and intuitive interface for working with their InterSystems IRIS data, without needing to build a full web front end from scratch.
What You Will Build (at a Glance)
Here is what the final Streamlit app look like:
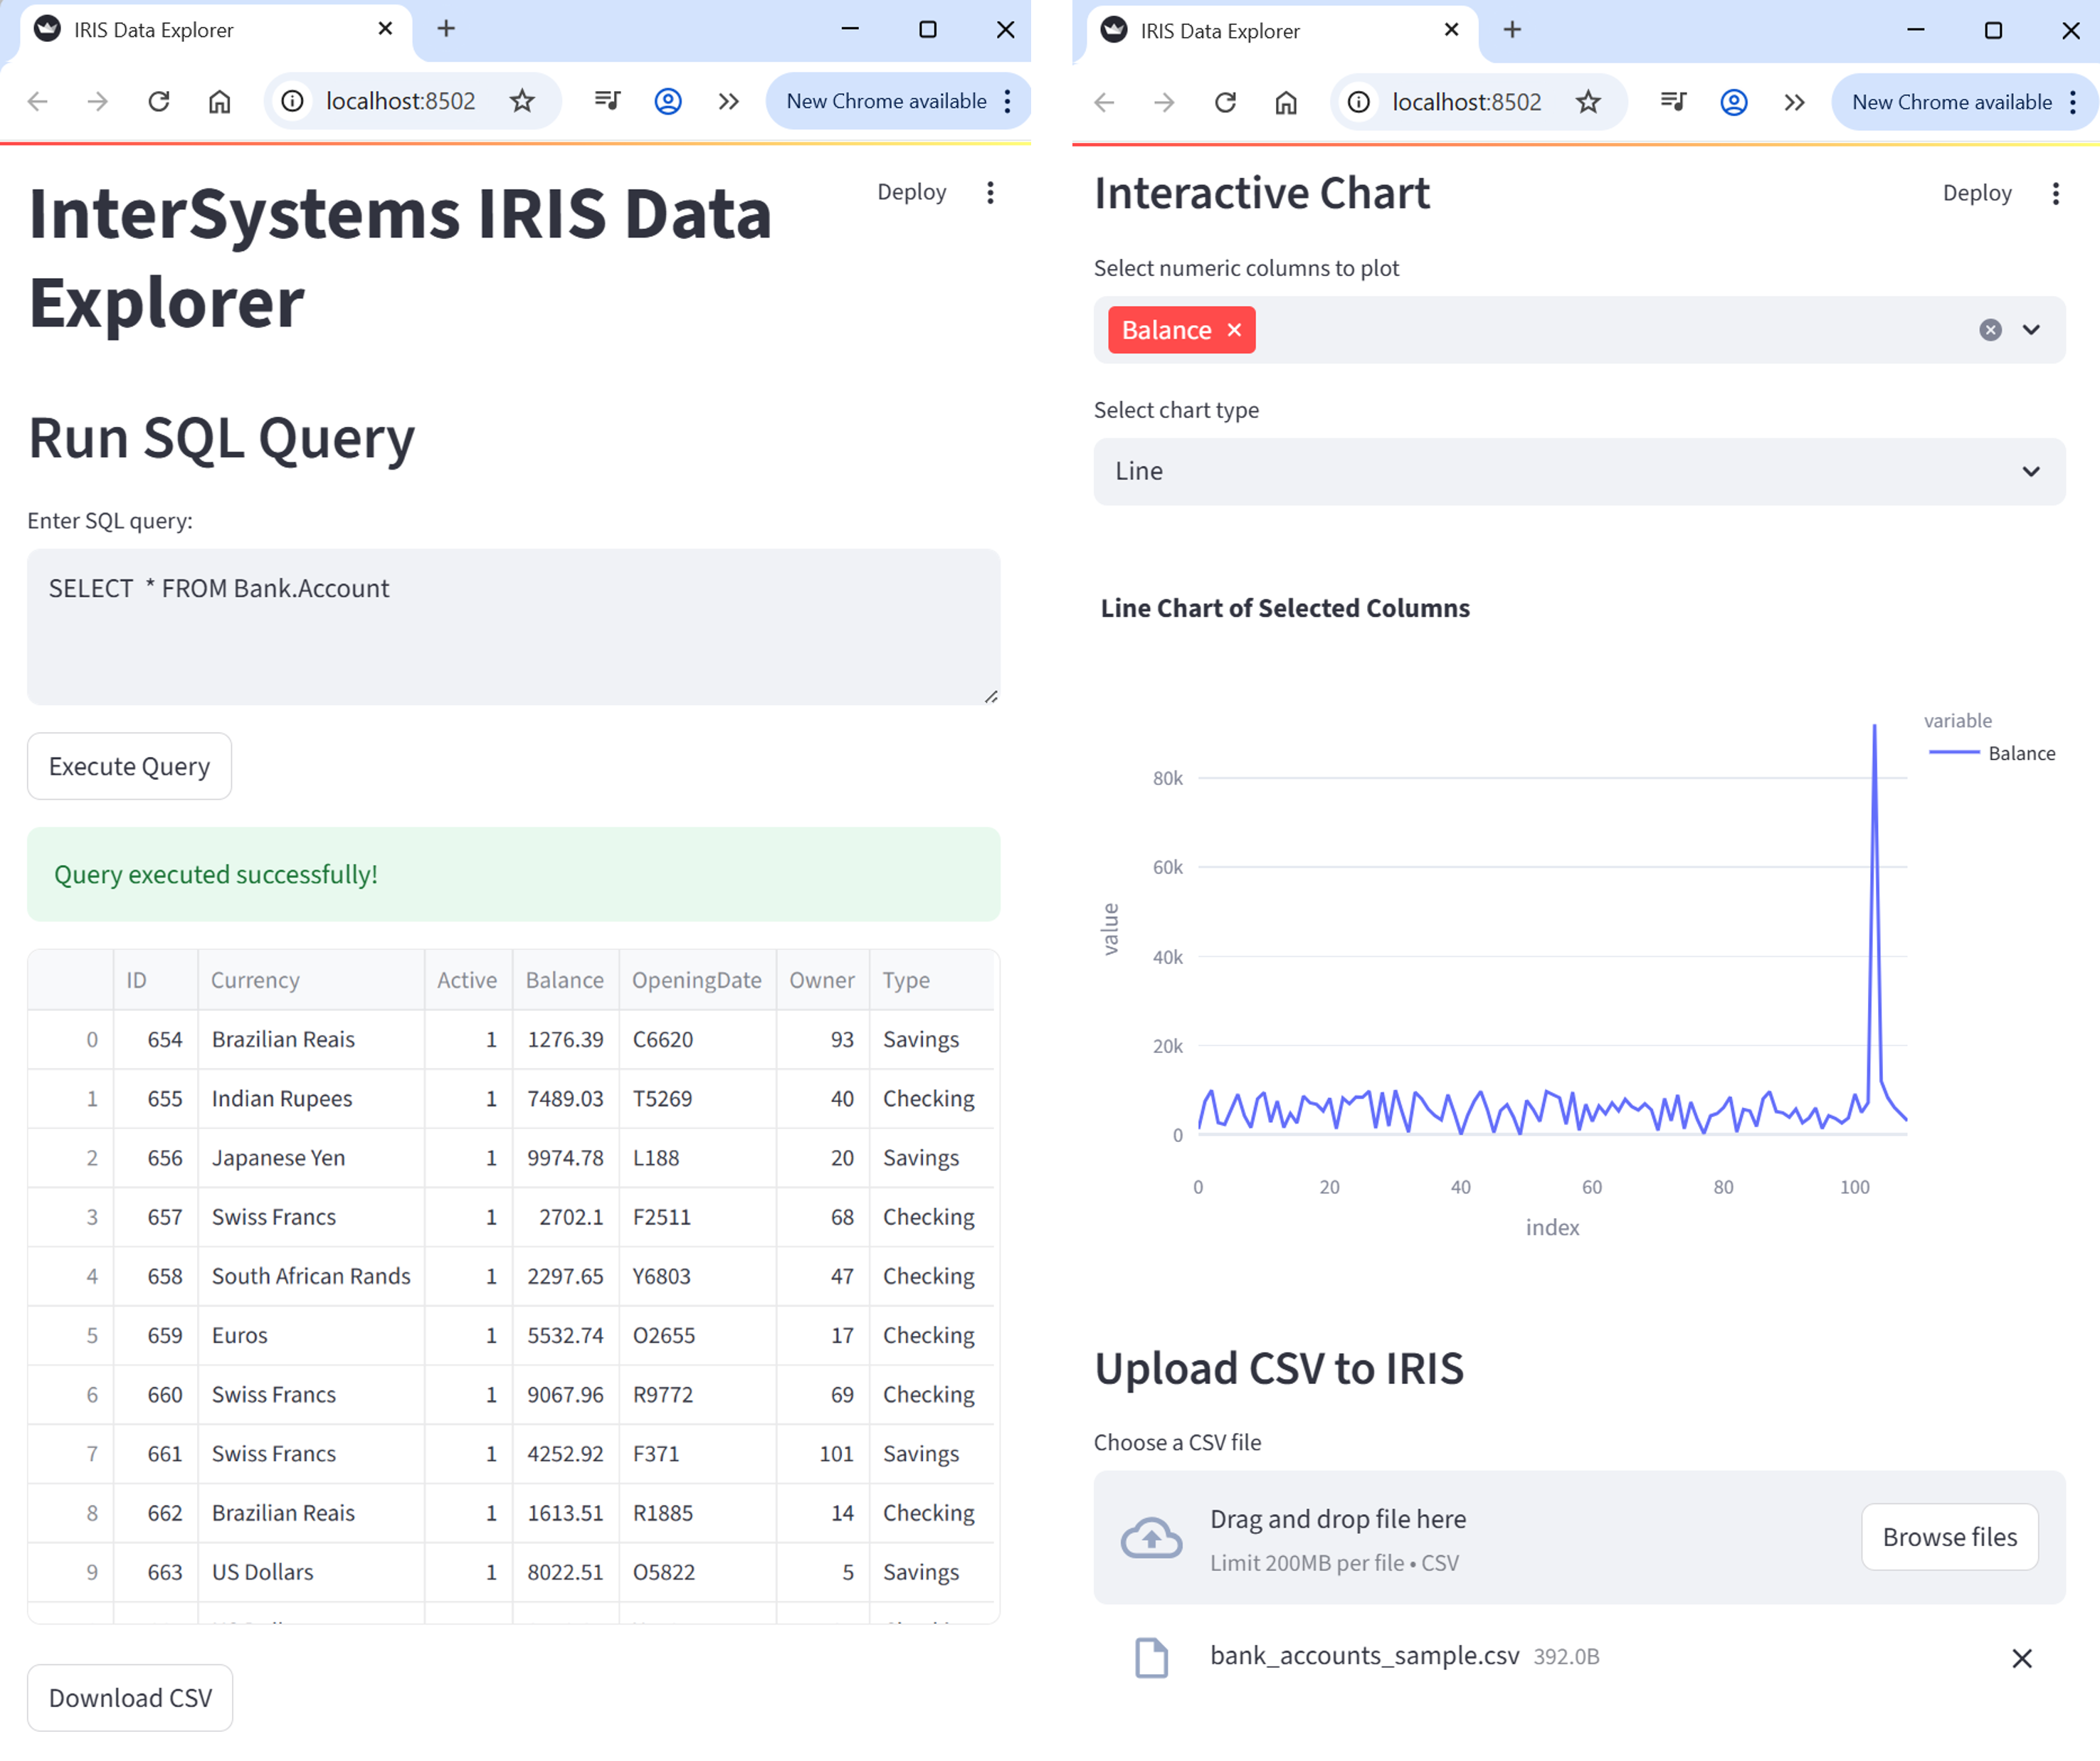
Connecting to InterSystems IRIS
To connect to InterSystems IRIS using SQLAlchemy, define a connection string and create an engine. This engine object will be reused throughout the app to run queries and insert data and acts like a persistent, reusable pipeline to your database.
from sqlalchemy import create_engine

# Replace with your credentials and connection information
username = "_SYSTEM"
password = "SYS"
namespace = "USER"
DATABASE_URL = f"iris//{username}:{password}@localhost:1972/{namespace}"

engine = create_engine(DATABASE_URL, echo=True)	# Set echo=True to see the SQL queries being excuted in the command line
For more documentation on using SQLAlchemy with InterSystems IRIS, see InterSystems IRIS and SQLAlchemy.
Configuring the Streamlit App Interface
Initialize the Streamlit app by setting the page configuration and title. This helps customize the app layout and metadata.
import streamlit as st

st.set_page_config(page_title="IRIS Data Explorer")
st.title("InterSystems IRIS Data Explorer")
set_page_config() allows you to customize the app’s layout and metadata.
Inputting Queries
Give users a text box to input SQL queries. You can provide an example query to help them get started.
st.header("Run SQL Query")

# Create a text area where users can input to input their SQL query
# The second argument is the default query shown in the box
query = st.text_area("Enter SQL query:", "SELECT TOP 10 * FROM Sample.Person")
This lets users interactively explore any part of the database they have access to.
Executing SQL Queries
When users click the “Execute Query” button, they run the query against your InterSystems IRIS database using engine.connect() and store the result in memory using st.session_state. The engine.connect()creates a connection between Streamlit and your data using SQLAlchemy (see InterSystems IRIS and SQLAlchemy for more details on this connection). Understanding the underlying mechanism in engine.connect()is not necessary to complete this application. Just know that you need a way to communicate between Streamlit and InterSystems IRIS. Using engine.connect() accomplishes that.
import pandas as pd

# Create a button labeled "Execute Query"
# When clicked, the code inside the if-block will run
if st.button("Execute Query"):
    try:
        # Open a connection to the InterSystems IRIS database using SQLAlchemy
        with engine.connect() as conn:
            # Use pandas to execute the SQL query and load the result into a pandas DataFrame
            df = pd.read_sql(query, conn)

        st.success("Query executed successfully")

        # Save df in session_state
        st.session_state['df'] = df

    except Exception as e:
        st.error(f"Error: {e}")
Streamlit reruns your script top-to-bottom on every user interaction. Using st.session_state helps you retain data like query results between runs. Without saving df into your session state, you will run into errors saying that df is undefined.
Displaying Query Results in a Table
Show the query results in an interactive table.
if 'df' in st.session_state:
    df = st.session_state['df']

    # Display the table in your Streamlit app
    st.dataframe(df)
The dataframe command displays an interactive table of your data. It allows you to sort, filter, and scroll through the table, all within the browser.
Downloading Query Results as CSV Files
Let users export their results as a CSV file through a download button widget.
if 'df' in st.session_state:
    csv = st.session_state['df'].to_csv(index=False).encode("utf-8")

    st.download_button(
        label="Download CSV",
        data=csv,
        file_name="results.csv"
        mime="text/csv"
    )
In the example above:
-
index=False removes the DataFrame’s index column from the CSV file.
-
UTF-8 encoding ensures broad compatibility.
-
The MIME type tells the browser that this is a CSV file.
This is useful for offline analysis or sharing results with others.
Visualizing Data
Plotly ExpressOpens in a new tab is a powerful graphing library that integrates well with Streamlit for generating all sorts of charts. By feeding the data you have been extracting into Plotly, you can produce nice visualizations in web browser, all within Streamlit. Regardless of what library you use (matplotlib, ggplot2, seaborn, etc.), you can use InterSystems IRIS and Streamlit to add visualizations to your applications.
Retrieving and Validating Data
Before rendering any chart, we need to:
-
Check if query results (df) are available.
-
Extract only numeric columns (since visualizations depend on numerical data).
# Check if a DataFrame from a previous query exists
if 'df' in st.session_state:
    df = st.session_state['df']		# Get the stored DataFrame

    # Identify numeric columns for plotting
    numeric_cols = df.select_dtype(include='number').columns.tolist()

    # Warn the user if there is nothing numeric to chart
    if df.empty or not numeric_cols:
        st.info("No numeric data available for visualization.")
Use select_dtypes(include='number') to filter numeric columns, which are required for charts like line, bar, and scatter plots.
User Input—Column and Chart Type Selection
Once numeric data is available, the user can:
-
Choose which numeric columns to plot.
-
Choose the type of chart they want to render.
else:
    st.subheader("Interactive Chart")

    # Multiselect input to choose numeric columns to plot
    cols = st.multiselect(
        "Select numeric columns to plot",
        options=numeric_cols,
        default=[numeric_cols[0]]		# Preselect the first numeric column
    )

    # Dropdown menu to select the chart type
    chart_type = st.selectbox(
        "Select chart type",
        ["Line", "Bar", "Area", "Scatter"]
    )
Use st.multiselect() to let users plot multiple columns at once. For scatter plots, ensure they choose exactly 2 columns.
The else statement comes from the fact that we first checked that there is some numeric data to chart from above.
Generating Chart
Based on the user’s inputs, we create the appropriate chart using Plotly Express.
import plotly.express as px

# Only proceed if columns are selected
if cols:
    fig = None

    if chart_type == "Line":
        fig = px.line(df, y=cols, title="Line Chart of Selected Columns")

    elif chart_type = "Bar":
        fig = px.bar(df, y=cols, title="Bar Chart of Selected Columns")

    elif chart_type == "Area":
        fig = px.area(df, y=cols, title="Area Chart of Selected Columns")

    elif chart_type == "Scatter":
        if len(cols) >= 2:
            fig = px.scatter(
                df,
                x=cols[0],		# First selected column as x-axis
                y=cols[1],		# Second selected column as y-axis
                title=f"Scatter Plot: {cols[0]} vs {cols[1]}"
            )
        else:
            st.warning("Select at least 2 columns for Scatter plot")
Rendering Chart
Finally, if a figure was successfully created, we render it in the Streamlit app.
# Render the Plotly figure inside the streamlit app
if fig:
    st.plotly_char(fig, use_containter_width=True)
Uploading CSV Data into InterSystems IRIS
Users can upload a CSV file through a Streamlit app and insert its contents into a pre-existing InterSystems IRIS table using SQLAlchemy.
Uploading a CSV
Give users the option to upload a CSV in the Streamlit app.
st.subheader("Uplaod CSV to IRIS")
upload_file = st.file_loader("Choose a CSV file", type="csv")
-
st.file_uploader allows users to upload files through the user interface.
-
The file type is restricted to .csv to ensure format consistency.
Previewing the Data
Once the file is uploaded, use pandas to read it and show a preview of it.
if uploaded_file:
    csv_df = pd.read_csv(uploaded_file)
    st.dataframe(csv_df.head())
-
pandas.read_csv() parses the file.
-
The first few rows of the uploaded file are displayed with .dataframe() for review before insertion.
Inputting Target Table Name
Ask the user to enter the InterSystems IRIS table name (for example, Sample.Person).
# Input: full table name in format "Namespace.Table"
full_table_name = st.text.input("Enter target IRIS table (e.g., Bank.Account)")
-
Users enter the full InterSystems table name, optionally including the namespace (for example, Bank.Account).
-
If a dot (.) is present, it is interpreted as schema.table.
Inserting Data into InterSystems IRIS
Now insert the DataFrame into the specified table.
if st.button("Insert Data"):
    try:
        # Split schema (namespace) and table name if dot notation is used
        if '.' in full_table_name:
            schema, table_name = full_table_name.split('.', 1)
        else:
            schema = None
            table_name = full_table_name

        # Attempt to insert the data into an existing table
        with engine.begin() as conn:
            csv_df.to_sql(
                name=table_name,
                con=conn,
                if_exists='append',
                index=False,
                schema=schema,
                method='multi'		# Batch insert to InterSystems IRIS
            )

        st.success(f"Successfully inserted data into {full_table_name}")

    except Exception as e:
        st.error(f"Insertion failed: {e}")
-
The input is parsed to separate the schema (namespace) and table name.
-
If no namespace is provided, schema=None is passed, and InterSystems IRIS uses the default namespace.
-
engine.begin() ensures that the operation runs within a transaction context.
-
In to_sql():
-
name is the table name.
-
schema is the InterSystems IRIS namespace (optional).
-
if_exists='append' prevents a table override.
-
method='multi' improves the performance by batching inserts.
-
The target table must already exist in InterSystems IRIS. This method does not create new tables.
If your table includes an auto-generated ID column, you must not try to insert into it directly unless explicitly allowed. To avoid RowID conflicts (for example, auto-generated ID columns), drop before ID inserting.
if "ID" in csv_df.column:
    st.warning("Dropping 'ID' column to let IRIS auto-generate it.")
    csv_df = csv_df.drop(columns=["ID"])
Running Your Application
Once you have finished building your Streamlit app, running it locally is quick and easy.
Save your complete code in a file (for example, app.py), and then your Streamlit app from the command line:
streamlit run app.py
If the streamlit is not recognized, you can also run it as a Python module:
python -m streamlit app.py
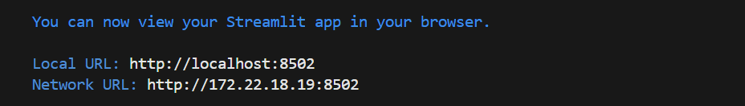
Your browser should automatically open the app. The command line will display logs, status updates, and the URL to access your app manually. You can now interact with your app live, whether you are running queries, uploading files, or visualizing data.
When you make changes to your app.py file:
-
Simply save the file, and Streamlit will detect changes.
-
By default, the Streamlit app prompts you to rerun it. Click “Always rerun” (in the top-right corner of the browser) for a smoother workflow.
Visit the official StreamlitOpens in a new tab, pandasOpens in a new tab, and PlotlyOpens in a new tab documentation to explore more available capabilities.
Complete Streamlit Code
The following is the entire code for the built Streamlit application.
# Initializing Streamlit app
import streamlit as st

import pandas as pd

# Import Plotly Express for interactive charting
import plotly.express as px

# SQLAlchemy Connection to InterSystems IRIS
from sqlalchemy import create_engine

# Connect to IRIS
username = "superuser"
password = "SYS"
namespace = "USER"
DATABASE_URL = f"iris://{username}:{password}@localhost:1972/{namespace}"

engine = create_engine(DATABASE_URL, echo=True)

st.set_page_config(page_title="IRIS Data Explorer")
st.title("InterSystems IRIS Data Explorer")

st.header("Run SQL Query")

# Create a text area where users can input their SQL query
# The second argument is the default query shown in the box
query = st.text_area("Enter SQL query:", "SELECT TOP 10 * FROM Sample.Person")

# Create a button labeled "Execute Query"
# When clicked, the code inside the if-block will run
if st.button("Execute Query"):
    try:
        # Open a connection to the IRIS database using SQLAlchemy
        with engine.connect() as conn:
            # Use pandas to execute the SQL query and load the result into a DataFrame
            df = pd.read_sql(query, conn)

        st.success("Query executed successfully!")

        # Display the resulting DataFrame as an interactive table in the app
        st.dataframe(df)

        # Save df in session_state
        st.session_state['df'] = df

    except Exception as e:
        st.error(f"Error: {e}")

if 'df' in st.session_state:
    csv = st.session_state['df'].to_csv(index=False).encode("utf-8")

    st.download_button(
        label="Download CSV",
        data=csv,
        file_name="results.csv",
        mime="text/csv"
    )

# Check if a DataFrame from previous query exists
if 'df' in st.session_state:
    df = st.session_state['df']  # Get the stored DataFrame

    # Identify numeric columns for plotting
    numeric_cols = df.select_dtypes(include='number').columns.tolist()

    # Warn the user if there's nothing numeric to chart
    if df.empty or not numeric_cols:
        st.info("No numeric data available for visualization.")

# Check if df is stored in session_state and visualize
if 'df' in st.session_state:
    df = st.session_state['df']

# Check if the query results DataFrame ('df') exists in Streamlit's session_state
if 'df' in st.session_state:
    df = st.session_state['df']  # Retrieve the DataFrame from session state

    # Extract only numeric columns from the DataFrame for plotting
    numeric_cols = df.select_dtypes(include='number').columns.tolist()

    # If no data is available or there are no numeric columns, notify the user
    if df.empty or not numeric_cols:
        st.info("No numeric data available for visualization.")
    else:
        # Display a subheader for the chart section
        st.subheader("Interactive Chart")

        # Allow users to select one or more numeric columns to plot
        # The default is the first numeric column
        cols = st.multiselect(
            "Select numeric columns to plot",
            options=numeric_cols,
            default=[numeric_cols[0]]
        )

        # Let users choose the type of chart to generate
        chart_type = st.selectbox(
            "Select chart type",
            ["Line", "Bar", "Area", "Scatter"]
        )

        # Only proceed if at least one column is selected
        if cols:
            fig = None  # Initialize the figure object

            # Generate the appropriate chart based on the selected type
            if chart_type == "Line":
                # Plot a line chart with the selected columns on the y-axis
                fig = px.line(df, y=cols, title="Line Chart of Selected Columns")

            elif chart_type == "Bar":
                # Plot a bar chart with the selected columns on the y-axis
                fig = px.bar(df, y=cols, title="Bar Chart of Selected Columns")

            elif chart_type == "Area":
                # Plot an area chart with the selected columns on the y-axis
                fig = px.area(df, y=cols, title="Area Chart of Selected Columns")

            elif chart_type == "Scatter":
                # Scatter plot requires at least 2 numeric columns
                if len(cols) >= 2:
                    # Use first column as x-axis and second as y-axis
                    fig = px.scatter(
                        df,
                        x=cols[0],
                        y=cols[1],
                        title=f"Scatter Plot: {cols[0]} vs {cols[1]}"
                    )
                else:
                    st.warning("Select at least 2 columns for Scatter plot")

            # If a valid figure was created, display it using Streamlit
            if fig:
                st.plotly_chart(fig, use_container_width=True)
                # use_container_width=True makes the chart responsive to app layout

st.subheader("Upload CSV to IRIS")

# File uploader for CSV files
uploaded_file = st.file_uploader("Choose a CSV file", type="csv")

if uploaded_file:
    # Read and preview the uploaded CSV
    csv_df = pd.read_csv(uploaded_file)
    st.dataframe(csv_df.head())

    # Input: full table name in format "Namespace.Table"
    full_table_name = st.text_input("Enter target IRIS table (e.g. Bank.Account)")

    if st.button("Insert Data"):
        try:
            # Split schema (namespace) and table name if dot notation is used
            if '.' in full_table_name:
                schema, table_name = full_table_name.split('.', 1)
            else:
                schema = None
                table_name = full_table_name

            # Attempt to insert data into existing table
            with engine.begin() as conn:
                csv_df.to_sql(
                    name=table_name,
                    con=conn,
                    if_exists='append',
                    index=False,
                    schema=schema,
                    method='multi'  # batch insert for IRIS
                )

            st.success(f"Successfully inserted data into '{full_table_name}'")

        except Exception as e:
            st.error(f"Insertion failed: {e}")
Building RESTful Flask Applications with InterSystems IRIS
Flask is a lightweight and flexible Python web framework, ideal for developing REST APIs and back-end services. When paired with SQLAlchemy and InterSystmes IRIS, Flask makes it easy to expose InterSystems IRIS data to front-end applications, services, and other consumers. This guide focuses on the InterSystems IRIS-specific setup steps so that you can get started quickly, and then proceed as with any other Flask app.
What You Will Learn
-
How to set up a basic Flask application.
-
How to connect Flask to InterSystems IRIS using SQLAlchemy.
-
How to use HTML templates and render data from InterSystems IRIS.
What You Will Build
By the end of this documentation, you will have a Flask web application that allows you to view your data in InterSystems IRIS through a clean user interface in the web browser.
Prerequisites
Before building the Flask app, make sure you have the following installed in addition to the setup from above
pip install flask
You should also have access to a running InterSystems IRIS instance and valid connection credentials (host, port, username, password, namespace).
Creating Your First Flask App
To get started with Flask, you will create a minimal web application that returns a simple message in the browser.
First, create a new folder for your project (my_flask). Inside it, create a file named app.py with the following content:
from flask import Flask, render_template

app = Flask(__name__)

@app.route("/")
def hello_world():
    return "<p>Hello World!</p>"

if __name__ == '__main__':
    app.run(debug=True)
In the code above:
-
Flask(__name__) creates the Flask application instance.
-
@app.route("/") decorator defines the route for the rool URL (/).
-
hello_world() is the view function returning a simple HTML message.
-
app.run(debug=True) starts the local development server with debugging enabled.
In Flask, routings map URLs to their respective functions (as defined by @app.route("<URL>")). Accessing these URLs triggers their associated functions. The / URL calls the home function (typically at http://127:0.0.1:5000/). To call other functions via other URLs (defined by @app.route("<URL>")), open http://127:0.0.1:5000/<URL> on your browser.
Do not name your application as flask.py for doing so creates a conflict with Flask itself.
Running the Flask Application
From the folder containing app.py, run the following in the command line:
python app.py
This starts the server, and you can now access your app at http://127:0.0.1:5000/.
Using HTML Templates
Web applications typically use HTML for rendering pages. Flask integrates the Jinja2 templating engine to separate your Python logic from HTML code. This separation improves code readability, maintainability, and reusability.
Understanding the detailed syntax and structure of HTML, CSS, and JavaScript is out of scope for this guide. Just know that you can use them within your Flask app to build dynamic, styled, and interactive webpages.
To implement an HTML template, follow these steps:
-
Create a folder named templates the same directory as app.py.
-
Inside templates, create a filed named index.html with this content:
<!DOCTYPE html> <html> <body> <h1>My First Heading</h1> <p>My First Paragraph</p> </body> <html> -
Modify app.py to render the template.
from flask import Flask

app = Flask(__name__)

@app.route("/")
def hello_world():
    return render_template('index.html')

if __name__ == '__main__':
    app.run(debug=True)
The following happens in the code above:
-
When a user accesses the root URL (/), Flask triggers the hello_world() function.
-
This function calls render_template('index.html'), which tells Flask to load and return the HTML from the templates/directory.
-
The templates/ folder is Flask’s default location for all HTML templates. Flask separates the front end (HTML/CSS/JS) from the back end (Python), making your codebase cleaner and easier to manage. This modular approach also makes it easier to scale your application as you add more pages and templates.
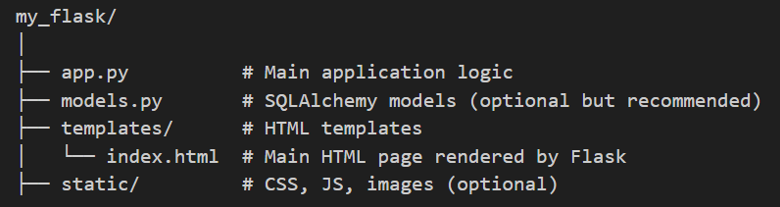
Folder Structure
This is a typical minimal Flask application layout. Each file and folder serve a specific role to separate the different parts of the application code and keep the project organized and maintainable.
What Each Folder Component Is
-
app.py
This is the entry point of the Flask application. It contains the route definitions, application configuration, and logic to start the server. It typically handles request routing and renders templates.
-
models.py
Contains the SQLAlchemy model definitions, which map Python classes to database tables. This helps abstract and manage database interactions cleanly.
Note:While models.py is not strictly required, it helps organize your Object Relational Mapping logic in a clean and modular way.
-
templates/
Flask uses Jinja2 templating and all HTML files go in this folder. The framework automatically looks for templates here when rendering views using render_template().
-
index.html
A specific HTML file inside the templates folder, typically used as the home page or main data table view. This is where your front end DataTable integration (like in render_template()) would live.
-
static/
Optional but useful for storing static files like custom CSS, JavaScript, images, or fonts. Flask will serve these files from the static/URL path automatically.
Flask intentionally does not enforce strict structures, so while this layout is clean and scalable, you are free to adapt it based on your application’s needs.
Connecting to InterSystems IRIS
To connect to InterSystems IRIS using SQLAlchemy, define a connection string and create an engine. This engine object will be reused throughout the app to run queries and insert data and acts like a persistent, reusable pipeline to your database.
from sqlalchemy import create_engine, text

# Replace with your credentials and connection information
username = "_SYSTEM"
password = "SYS"
namespace = "USER"
DATABASE_URL = f"iris://{username}:{password}@localhost:1972/{namespace}"

engine = create_engine(DATABASE_URL, echo=True)	# Set echo=True to see the SQL queries being excuted in the terminal
For more documentation on using SQLAlchemy with InterSystems IRIS, see InterSystems IRIS and SQLAlchemy.
Transferring Data from InterSystems IRIS to Flask and Displaying it
tables.html
The following provides the web page structure for viewing the InterSystems IRIS data. It utilizes jQuery DataTablesOpens in a new tab, a popular JavaScript library used to create dynamic, interactive tables with features like pagination, sorting, searching, and responsive layouts. It also incorporates BootstrapOpens in a new tab, a modern CSS framework that provides a responsive grid system, pre-styled UI components, and utility classes. Bootstrap is used here to style the table and layout elements (such as spacing and table orders), ensuring the table looks clean and is mobile-responsive.
<!DOCTYPE html>
<html>

<head>
    <title>Display InterSystems IRIS Data with DataTables</title>

    <!-- Bootstrap 5 for styling -->
    <link href="https://cdn.jsdelivr.net/npm/bootstrap@5.3.0/dist/css/bootstrap.min.css" rel="stylesheet">

    <!-- jQuery (required by DataTables) -->
    <script src="https://code.jquery.com/jquery-3.6.0.min.js"></script>

    <!-- DataTables + Bootstrap 5 integration -->
    <link rel="stylesheet" href="https://cdn.datatables.net/1.13.5/css/dataTables.bootstrap5.min.css">
    <script src="https://cdn.datatables.net/1.13.5/js/jquery.dataTables.min.js"></script>
    <script src="https://cdn.datatables.net/1.13.5/js/dataTables.bootstrap5.min.js"></script>
</head>

<body class="container py-4">

    <h2 class="mb-4">InterSystems IRIS Data Table</h2>

    <!-- HTML table to be populated dynamically -->
    <table id="myTable" class="table table-bordered table-striped table-hover"></table>

    <script>
        $(document).ready(function () {
            // Convert server-passed JSON strings into JavaScript objects
            let my_data = JSON.parse('{{ my_data | tojson | safe }}');
            let my_cols = JSON.parse('{{ my_cols | tojson | safe }}');

            // Initialize DataTable with server data and column definitions
            $('#myTable').DataTable({
                data: my_data,
                columns: my_cols,
                responsive: true,
                lengthMenu: [5, 10, 25, 50],
                pageLength: 10,
                language: {
                    search: "_INPUT_",
                    searchPlaceholder: "Search records"
                }
            });
        });
    </script>

</body>

</html>
Just like with index.html, understanding the code above is not within the scope of this documentation. The takeaway here is that you can integrate these tools into your Flask application. Refer to the official documentation of these libraries to learn more about them.
app.py
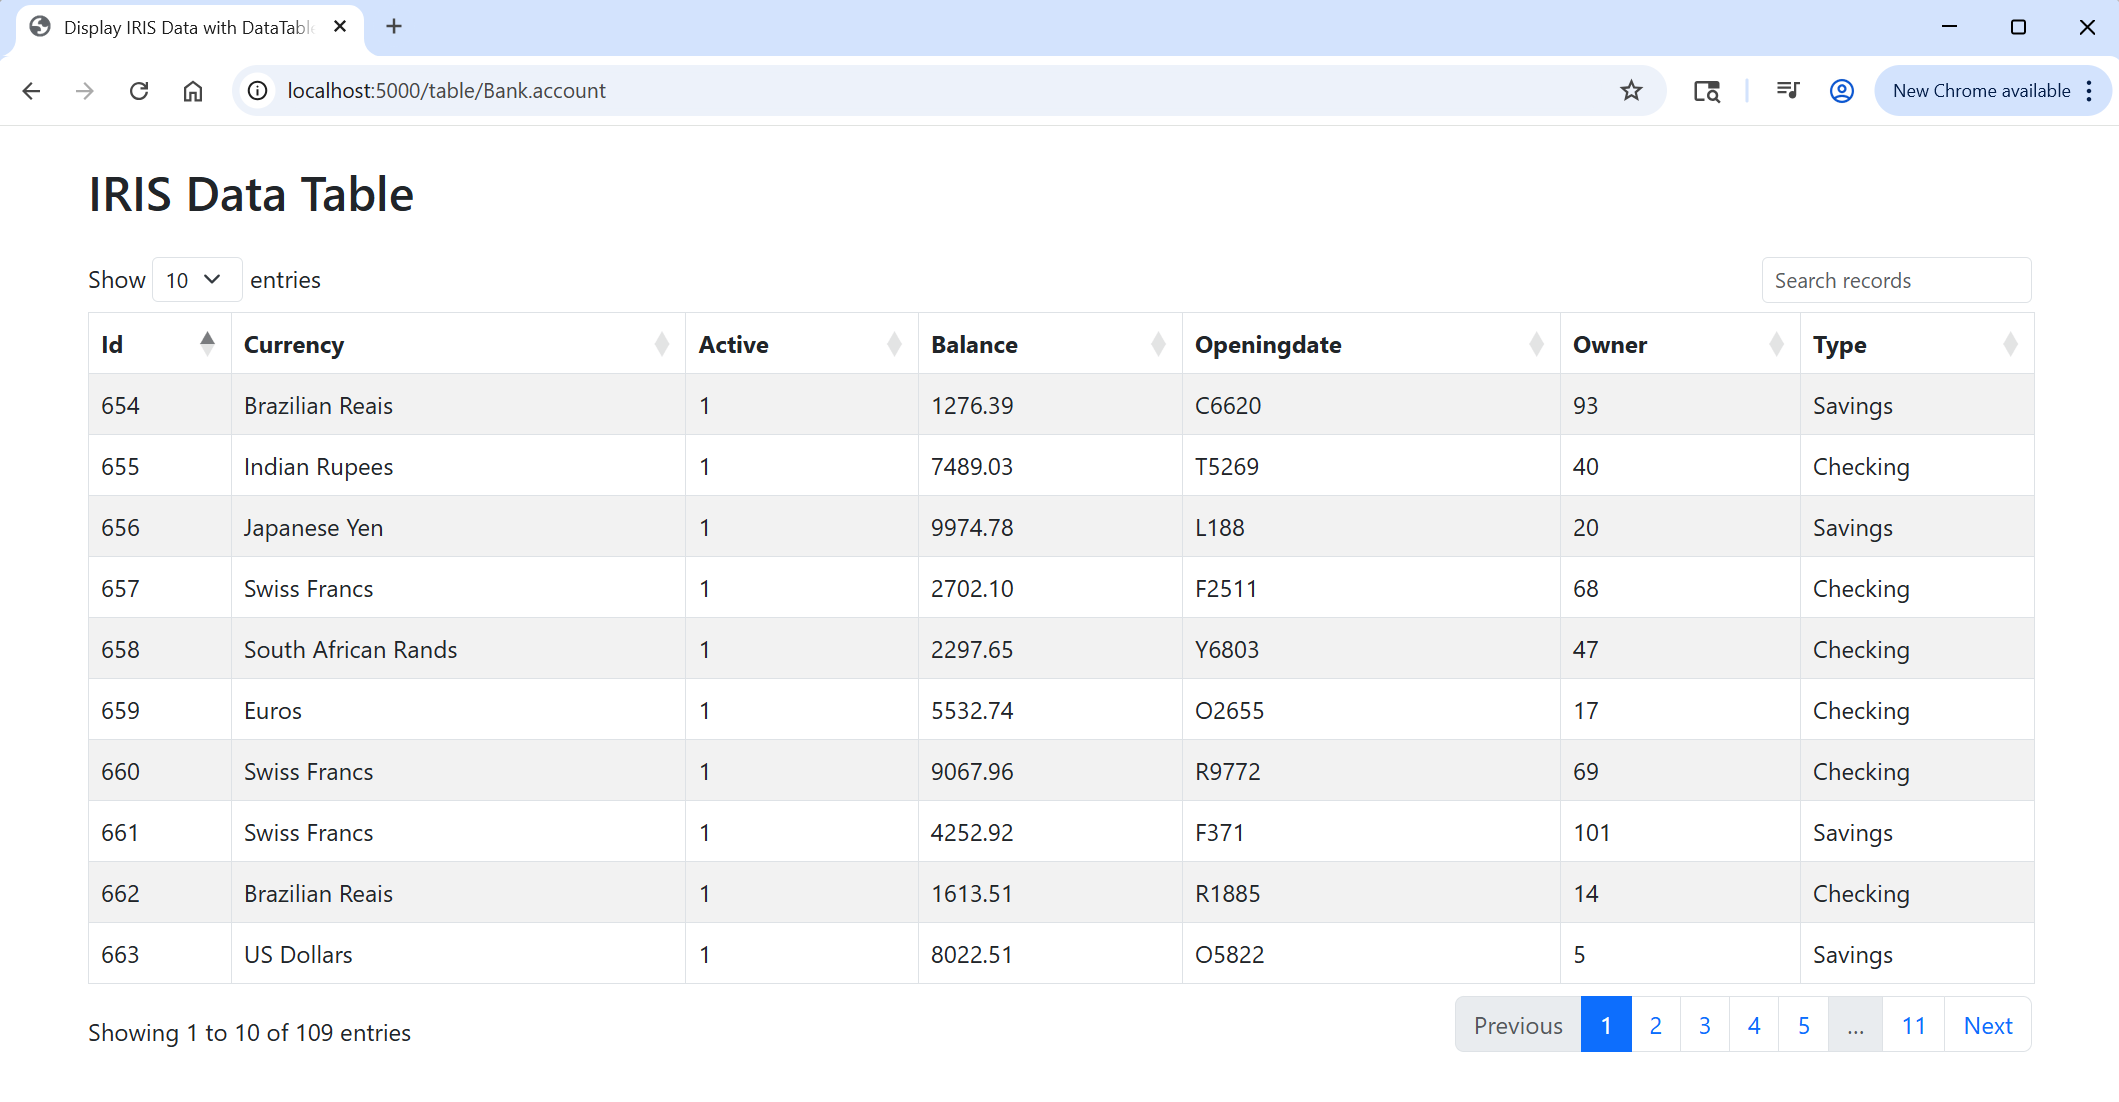
Create a dynamic view into your InterSystems IRIS data through the /table/ URL route. Using a connection via the SQLAlchemy engine to your InterSystems IRIS database, query data from the specified table and populate it into your Flask app. Pass the resulting data to the HTML template from above to create a clean and structured display of it in the web page.
You can specify which table to query directly through the URL. For example, to view data from a table called Bank.Account, open http://127:0.0.1:5000/table/Bank.Account on your browser.
The app will:
-
Parse the table name (optionally including the schema).
-
Execute a SELECT * FROM table ORDER BY 1 query.
-
Convert the results into a list of dictionaries.
-
Dynamically extract column names.
-
Render the tables.html template with your data and columns.
@app.route("/table/<path:table_name>")
def show_table(table_name):
    # table_name could be "Schema.Table" or just "Table"
    try:
        # Validate and split schema/table if schema is provided
        if '.' in table_name:
            schema, table = table_name.split('.')
            full_table = f"{schema}.{table}"
        else:
            schema = None
            table = table_name
            full_table = table

        # Query to get data from the specified table
        query = f"SELECT * FROM {full_table} ORDER BY 1"

        with engine.connect() as conn:
            result = conn.execute(text(query))
            keys = result.keys()		# get column names
            rows = [dict(zip(keys, row)) for row in result]

        if not rows:
            return f"No data found in table {full_table}", 404

        # Extract columns dynamically from first row keys
        columns = [{"data": col, "title": col.capitalize()} for col in rows[0].keys()]

        return render_template("tables.html", my_data=rows, my_cols=columns)

    except Exception as e:
        return f"Error: {str(e)}", 500
In the code above:
-
<path:table_name> defines a Flask route where table_name can include dots (for example, Bank.Account), The :path converter allows such values to be passed as arguments into the view function.
-
Flask uses the Jinja2 templating engine, which allows you to pass arguments (like rows and columns) from your view function into your HTML templates. These variables can be inserted dynamically using the syntax {{variable}} (see tables.html as an example).
-
if '.' in table_name splits the table into schema and table components when the format includes a dot.
-
rows = [dict(zip(keys,row) for row in result] passes both the row data and column definitions into the HTML template, enabling a dynamic and responsive table view.
Note:The result returned by conn.execute() is not a dictionary. Instead, it is an iterable of row tuples or RowProxy objects. To make data easier to work with in Jinja2 templates, the code converts each row to a dictionary by pairing column names with values using zip().
This application enables you to quickly browse and visualize any table in your InterSystems IRIS database by simply modifying the URL. It dynamically pulls and formats tables using SQLAlchemy, then renders it in a styled HTML table using Jinja2. The use of dynamic route arguments and template variables makes it flexible for inspecting a wide range of tables without modifying the back-end logic.
This documentation only touches the surface of Flask. Now that you know how to get started creating a Flask application with InterSystems IRIS, you can fully utilize all of Flask’s features just as with any other Flask application.
To dive deeper into Flask, visit the official Flask documentationOpens in a new tab.
Complete Flask Code
The following is the code for the Flask application built. Be aware of the file structure required to have the application running smoothly.
#app.py

from flask import Flask, render_template
from sqlalchemy import create_engine, text

# Replace with your credentials and connection information
username = "_SYSTEM"
password = "SYS"
namespace = "USER"
DATABASE_URL = f"iris://{username}:{password}@localhost:1972/{namespace}"

engine = create_engine(DATABASE_URL, echo=True)	# Set echo=True to see the SQL queries being excuted in the terminal

app = Flask(__name__)

# ---------- ROUTES ----------
@app.route("/")
def hello_world():
    # main index page
    return render_template("index.html")

@app.route("/table/<path:table_name>")
def show_table(table_name):
    # table_name could be "Schema.Table" or just "Table"
    try:
        # Validate and split schema/table if schema is provided
        if '.' in table_name:
            schema, table = table_name.split('.')
            full_table = f"{schema}.{table}"
        else:
            schema = None
            table = table_name
            full_table = table

        # Query to get data from the specified table
        query = f"SELECT * FROM {full_table} ORDER BY 1"

        with engine.connect() as conn:
            result = conn.execute(text(query))
            keys = result.keys()		# get column names
            rows = [dict(zip(keys, row)) for row in result]

        if not rows:
            return f"No data found in table {full_table}", 404

        # Extract columns dynamically from first row keys
        columns = [{"data": col, "title": col.capitalize()} for col in rows[0].keys()]

        return render_template("tables.html", my_data=rows, my_cols=columns)

    except Exception as e:
        return f"Error: {str(e)}", 500
<!-- index.html -->

<!DOCTYPE html>
<html>

<body>
    <h1>My First Heading</h1>
    <p>My First Paragraph</p>
</body>

<html>
<!-- tables.html -->
<!DOCTYPE html>
<html>
<head>
<title>Display IRIS Data with DataTables</title>
<!-- Bootstrap 5 for styling -->
<link href="https://cdn.jsdelivr.net/npm/bootstrap@5.3.0/dist/css/bootstrap.min.css" rel="stylesheet">
<!-- jQuery (required by DataTables) -->
<script src="https://code.jquery.com/jquery-3.6.0.min.js"></script>
<!-- DataTables + Bootstrap 5 integration -->
<link rel="stylesheet" href="https://cdn.datatables.net/1.13.5/css/dataTables.bootstrap5.min.css">
<script src="https://cdn.datatables.net/1.13.5/js/jquery.dataTables.min.js"></script>
<script src="https://cdn.datatables.net/1.13.5/js/dataTables.bootstrap5.min.js"></script>
</head>
<body class="container py-4">
<h2 class="mb-4">IRIS Data Table</h2>
<!-- HTML table to be populated dynamically -->
<table id="myTable" class="table table-bordered table-striped table-hover"></table>
<script>
$(document).ready(function () {
// Convert server-passed JSON strings into JavaScript objects
let my_data = JSON.parse('{{ my_data | tojson | safe }}');
let my_cols = JSON.parse('{{ my_cols | tojson | safe }}');
// Initialize DataTable with server data and column definitions
$('#myTable').DataTable({
data: my_data,
columns: my_cols,
responsive: true,
lengthMenu: [5, 10, 25, 50],
pageLength: 10,
language: {
search: "_INPUT_",
searchPlaceholder: "Search records"
}
});
});
</script>
</body>
</html>