
Performing Ad Hoc Analysis
This page describes ways to analyze the data you see when viewing a pivot table in the Business Intelligence Analyzer.
Also see Accessing the BI Samples.
Displaying a Detail Listing
A detail listing displays fields at the lowest level, for the records associated with one or more selected cells. You can display a default listing, select a different listing to display, or even select the fields to display. You can also sort the detail listing. The following subsections provide the details and also describe how to exit the listing.
If you display a listing and save the pivot table, the Analyzer saves its listing state. That is, when you next open it, the Analyzer redisplays the pivot table as a listing. Similarly, if it is included in any dashboards, it is displayed there as a listing.
Displaying the Default Detail Listing
To display the default detail listing:
-
Display a pivot table as usual.
-
Click the data cells in the row or rows.
To select multiple cells, hold the Shift key down while clicking the cells.
To select an entire row, click the row label on the left. To click an entire column, click the column header.
The listing option is not available for cells in a total row or a total column.
-
Click the Listing button
 .
.
The Pivot Preview area displays something like the following:
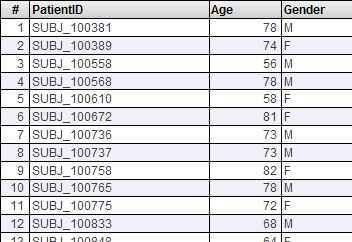
If there are more than 100 rows, the bottom area displays buttons that you can use to page through all the rows.
The Pivot Builder area now displays the Custom Listing Fields box, which is for use when you select fields to display, if possible.
Displaying a Different Detail Listing
To display a different listing:
-
Display the default listing as described earlier.
-
Select Detail Listings in the Model Contents area.
-
Click the name of the listing to display.
Typically each listing uses a different set of fields and is meant for a different purpose.
If the name of a listing is italicized, that indicates that this listing is defined in a listing group and that you have the necessary permissions to modify the listing. See Defining Listing Groups.
Or, before you display the listing, do the following:
-
Click the Pivot Options button
 .
. -
Select a listing from the Listing drop-down menu.
-
Click OK.
Creating a Custom Listing
Depending on the subject area, you might be able to create a custom listing that uses fields that you select. To do so:
-
Display the default listing as described earlier.
-
Select Detail Listings in the Model Contents area.
-
Select Custom Listing.
The system then displays a listing that initially shows only the IDs of the records.
-
Optionally clear the Auto-execute check box.
This is helpful if the listing uses many records, because each time when you change the listing definition, the system reruns the corresponding query by default. When Auto-execute is off, the system does not rerun the query automatically.
-
Expand the Custom Listing folder. For example:
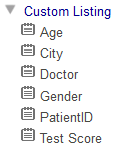
This folder lists the available listing fields in this subject area.
Note that the sample Patients cube defines a listing named Custom listing. This listing is an ordinary listing defined with custom syntax and cannot be used as described here.
-
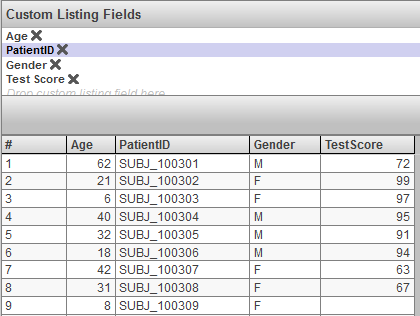
Drag listing fields from this area to the Custom Listing Fields box.
-
If you cleared the Auto-execute check box, use the Refresh button
 in the Pivot Builder area.
The system then runs the query and displays the results. For example:
Sorting a Listing
By default, the definition of a listing controls the order of the rows.
You can instead sort the listing by the values shown in any data column. To do so, double-click the column header.
The first time you double-click the column header, the listing is sorted in ascending order, by the values in that column, and the column header includes the >> characters to indicate this sorting.
If you double-click the column header again, the listing is sorted in descending order instead (and the column header includes the << characters). If you double-click a third time, the sorting is removed and the default order is restored.
Listings on pivots based on data connectors cannot be sorted.
Exiting the Listing
To exit the listing and redisplay the pivot table, do either of the following:
-
Click the left arrow button
-
Click the Display Table button:

Drilldown via Double-Click
In some cases, you can drill down by double-clicking a row (other than a total row).
In some of these cases, the system uses the hierarchy, if any, to determine how to drill down. In other cases, the system drills down in a custom manner, as defined in the pivot table.
The drilldown action has no effect if the pivot table uses a manually entered MDX query. See Specifying the MDX Query Manually.
Drilldown in a Hierarchy
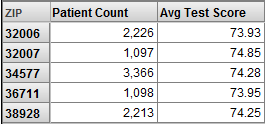
This section describes drilldown in a hierarchy. For example, in the Patients sample, The ZIP code level is the parent of the city level. Consider the following pivot table:
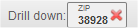
If you double-click the cell 38928, the system displays the following in the upper right of the pivot builder area:
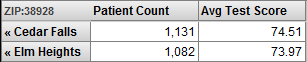
And the pivot table looks like this:
Custom Double-Click Drilldown
To customize how the system drills down, see Customizing Double-Click Drilldown. This section provides a demonstration.
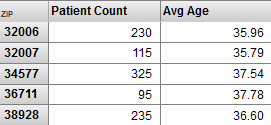
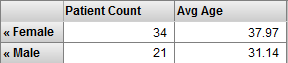
For example, consider the following pivot table:
Suppose that for this pivot table, we specify Drilldown Expression as follows:
colord.h1.[favorite color].members
gend.h1.gender.members
If we double-click the cell 32006, the pivot table then looks like this:
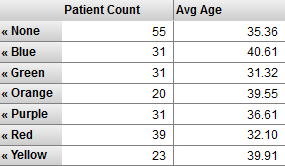
If we double-click the cell None, the pivot table then looks like this:
If we double-click again, nothing further happens.
Saving the Drilldown
If you drill down in a pivot table and then save it, the Analyzer saves its drilldown state. That is, when you next open it, the Analyzer redisplays the pivot table with the drilldown. Similarly, if the pivot table is included in any dashboards, they display it in its drilldown state.
Clearing the Drilldown
To clear the drilldown of a pivot table, you can do any of the following:
-
Click the left arrow button in the toolbar.
-
Click the X button in the Drill down area in the toolbar, if applicable.
-
Click the << arrows in any of the rows in the pivot table.
Performing Arbitrary Drilldown
In the drilldown action, you focus on a row in the pivot table and see a different breakout for that row. To drill down in an arbitrary way, drag and drop any level from the Model Contents pane onto the non-scrolling part of a row in the pivot table.
For example, suppose that you start with the following pivot table:
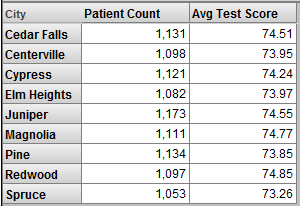
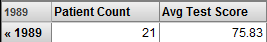
Suppose that you expand the level list in the Model Contents pane (not shown) to display the birth year 1989. Then drag and drop 1989 onto Elm Heights. The system displays the label Drilldown: Year 1989 in the upper right of the pivot builder area, and the pivot table looks like this:
This option is not available for a total row.
Also see Saving the Drilldown State and Clearing the Drilldown State, earlier in this page.
The drilldown action has no effect if the pivot table uses a manually entered MDX query. See Specifying the MDX Query Manually.
Introduction to the Pivot Analysis Window
The Analyzer also provides the Pivot Analysis window, which you can use for several specialized analyses. In each case, you first select one or more cells, and the analysis considers the lowest-level data associated with those cells. To access this window:
-
Click the data cells in the row or rows.
To select multiple cells, hold the Shift key down while clicking the cells.
To select an entire row, click the row label on the left. To click an entire column, click the column header.
The analysis option is not available for cells in a total row or a total column.
-
Click the Analysis button
 .
.
For details, see Using the Analysis Window. (The same analysis options are also present in dashboards.)