
Introduction
Introduction
The Analyzer enables you to create pivot tables, which display aggregated data. Each pivot table is based upon a subject area or a cube. (In the Analyzer, the terms subject area and cube are equivalent to each other; this book uses the term subject area.) When you access the Analyzer, you must choose the subject area to work with. The Analyzer then displays the elements defined in that subject area, which you drag and drop to create pivot tables.
Pivot tables are central to InterSystems Business Intelligence; they select and aggregate data. The following figure shows an example pivot table that shows the number of patients and the average allergy count per patient, grouped by age and gender.
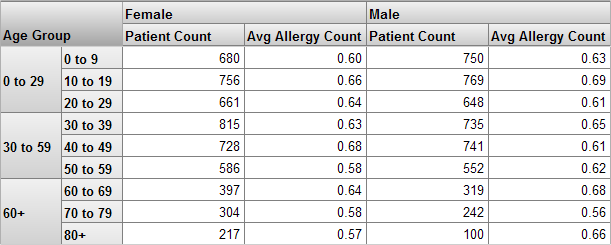
A level is used to group the source data. A level has members. Each member, in turn, corresponds to a specific set of records in the source data. For example, the Age Group level has the members 0-29, 30-59, and 60+. The Gender level has the members Female and Male.
A measure is a value displayed in the body of the pivot table; it is based on values in the source data. For a given context, a measure aggregates the values for all applicable source records and represents them with a single value. For example, the measure Patient Count is the number of patients, and the measure Avg Allergy Count is the average number of allergies per patient.
The preceding example shows a preview of a pivot table within the Analyzer, which provides a large set of tools for modifying, exporting, formatting, and so on.