
Adding a Summary Row or Column
Adding a Summary Row or Column
You can add a summary row, summary column, or both. This section describes the following approaches:
Adding a Summary Row or Column as a Pivot Option
To add a summary row, summary column, or both:
-
Click the Pivot Options button
 .
.The Analyzer displays the Pivot Options page, which is discussed in detail later in this book.
This procedure discusses only the Summary option.
-
Click the Summary check box.
-
Select a summary option from the drop-down list. The options are as follows:
-
Sum — Displays the sum of the values.
-
Count — Displays the count of rows.
-
Max — Displays the maximum of the values.
-
Min — Displays the minimum of the values.
-
Average — Displays the average of the values.
-
% of Total — Displays the sum of the values of this column (or row), as a percentage of the sums of all columns (or rows).
For information on overriding how the summary is computed for a given measure, see Specifying Alternative Aggregation Methods for a Measure.
-
-
(For summary rows only) Optionally, to cause the summary row to summarize all rows (including rows on later pages), select All Rows from the second drop-down list.
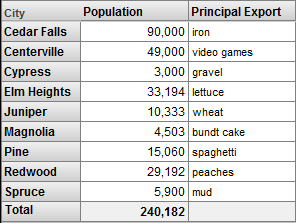
For example, the following pivot table includes a total row. Notice that it displays the total only for numeric values:
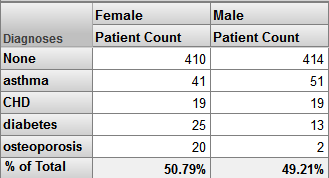
The following example shows % of Total, which is useful primarily when you use a level in Columns:
In contrast to the other forms of summaries, note the following:
-
If you display the pivot table as a chart, the chart does not include the summary row or column.
-
If you export to Excel, the summary is included only if it is a sum.
Adding the All Member as a Summary Row or Column
Your cube may include one or more All members. Each dimension can contain a All member, which is listed within the dimension, in the Model Contents pane, before any levels. For example:
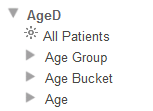
An All member represents all records and is typically named something like All Ages or All Categories. Or, as in the example shown here, the All member might have a truly generic name.
You can drag and drop this member to Rows or Columns to add it as a summary row or column. For example:
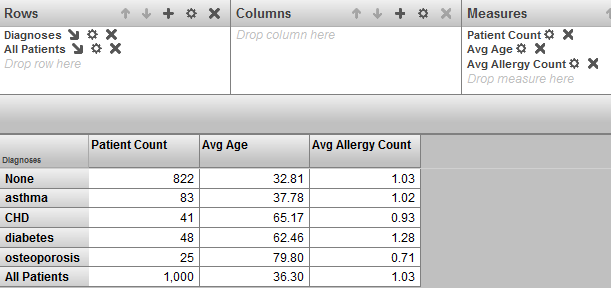
In contrast to using the pivot options, this approach allows each measure to be aggregated in a different manner. The Patient Count measure is summed, and the Avg Age and Avg Allergy Count measures are averaged.
If you do not have any All members, you can add a custom aggregation.
Adding a Summary Row or Column as a Custom Aggregation
This section describes how to add a summary row as a custom aggregation. The technique is easily adapted for a summary column.
-
For the level used as the rows, add the same level again to the Rows box.
-
Click the Advanced Options button
 next to the second level in Rows.
The Analyzer displays the Advanced Options page, which is discussed in detail later in this book.
-
Select Compute Aggregate and then select an aggregation function. You can use any of the following functions:
-
SUM — For each displayed measure, display the sum of the values of the members.
-
AVG — For each displayed measure, display the average of the values of the members.
-
MIN — For each displayed measure, display the minimum of the values of the members.
-
MAX — For each displayed measure, display the maximum of the values of the members.
-
COUNT — For each displayed measure, display the count of the members.
-
COUNT NONEMPTY — For each displayed measure, display the count of the members that have values in the current context.
-
AGGREGATE — For each displayed measure, display the aggregate value of the members, using the aggregation method defined for that measure.
-
MEDIAN — For each displayed measure, display the median of the values of the members.
-
STDDEV — For each displayed measure, display the standard deviation of the values of the members.
-
VARIANCE — For each displayed measure, display the variance of the values of the members.
-
PERCENTILE — For the given percentile value and for each displayed measure, display the measure value that is at that percentile value.
For this option, you can specify a percentile value in the Percentile field; the default is 50.
-
-
Optionally type a new caption into Caption. The default caption is the name of the function.
When you use this option, the system first uses any other settings you specified on this dialog box.
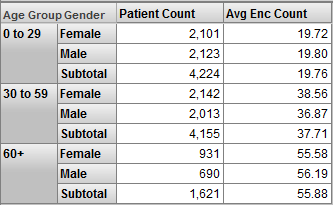
For example, consider the following pivot table:
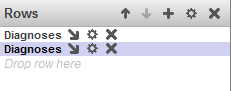
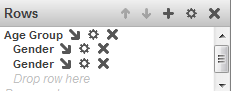
This pivot table is defined with the following items in Rows:
The second Gender item uses the following options:
-
Compute Aggregate is Aggregate
-
Caption is Subtotal