
Measures and Levels
Measures and Levels
In this section, we take a closer look at measures and levels.
-
Click New.
-
Drag and drop Patient Count and Avg Age, to the Measures area.
You now see something like this:
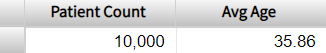
This simple pivot table shows us the aggregate value for each of these measures, across all the records in the base class. There are 10000 patients and their average age (in this example) is 35.93 years.
-
Compare these values to the values obtained directly from the source table. To do so:
-
In a separate browser tab or window, access the Management Portal and go to the namespace into which you installed the samples, as described earlier.
-
Navigate to Home > System Explorer > SQL.
-
Click the Execute Query tab.
-
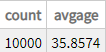
Execute the following query:
select count(*) as "count",avg(age) as avgage from bi_study.patient
You should see the same numbers. For example:
 Tip:
Tip:Leave this browser tab or window open for later use.
-
-
In the Analyzer, modify the previous pivot table as follows:
-
Expand GenD on the left.
-
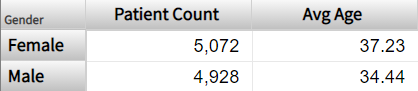
Drag and drop Gender to the Row area. Now you see something like the following:
-
-
Compare these values to the aggregate values obtained from the source table. To do so:
-
Access the Management Portal and go to the namespace into which you installed the samples, as described earlier.
-
Navigate to Home > System Explorer > SQL.
-
Click the Execute Query tab.
-
Click Show History.
-
Click the query you ran previously.
-
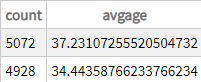
Add the following to the end of the query and then rerun the query:
group by genderYou should see the same numbers as shown in the pivot table. For example:
-
-
For a final example, make the following change in the Analyzer:
-
Click the X button in the Rows pane. This action clears the row definition.
-
Expand ProfD and Profession.
-
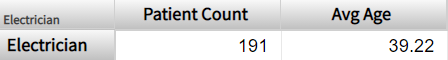
Drag and drop Electrician to Rows.
The system displays something like this:
-
-
Compare these values to the values from the source table. To do so:
-
Access the Management Portal and go to the namespace into which you installed the samples, as described earlier.
-
Navigate to Home > System Explorer > SQL.
-
Click the Execute Query tab.
-
Execute the following query:
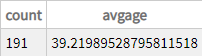
select count(*) as "count",avg(age) as avgage from bi_study.patient join bi_study.patientdetails
on bi_study.patient.patientid = bi_study.patientdetails.patientid
where bi_study.patientdetails.profession->profession='Electrician'
You should see the same numbers. For example:
-