Listings
Listings
This part of the tutorial demonstrates listings, which display selected records from the lowest-level data for the selected cell or cells. To see how these work, we will first create a pivot table that uses a very small number of records. Then when we display the listing, we will be able to compare it easily to the aggregate value of the cell from which we started.
-
Click New.
-
Drag and drop Patient Count and Avg Test Score to Measures.
-
Expand the AgeD dimension in the Model Contents pane.
-
Expand the Age level.
-
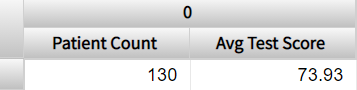
Drag and drop the member 0 to Columns. This member refers to all patients who are less than 1 year old.
Note that you must click the member name rather than the icon to its left.
The system displays something like the following:
-
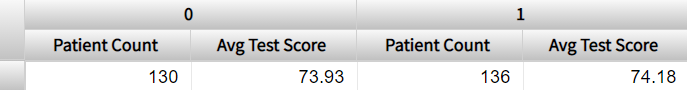
Drag and drop the member 1 to Columns, below the member 0.
The system displays something like the following:
-
Expand the BirthTD dimension.
-
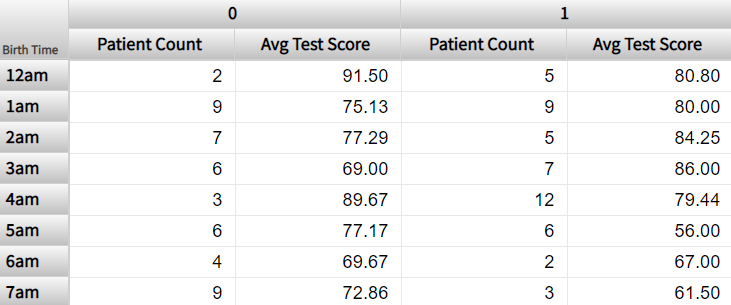
Drag and drop the Birth Time level to Rows.
The system displays something like the following:
-
Click a cell. For example, click the Patient Count cell in the 12am row, below 0.
-
Click the Display Listing button
 .
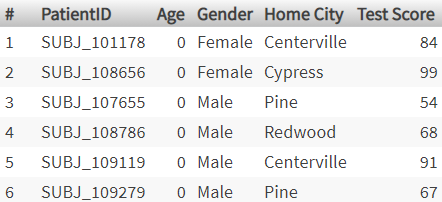
.The system considers the selected context, which in this case is patients under 1 year old, who were born between midnight and 1 am. The system then executes an SQL query against the source data. This query includes selected fields for these patients, as follows:
-
Count the number of rows displayed. This equals the Patient Count value in the row you started from.
-
Click the Display Table button
 to redisplay the pivot table in its original state.
By default, the Patients cube uses a listing called Patient details, which includes the fields PatientID, Age, Gender, and others, as you just saw. You can display other listings as well.
-
Click the Pivot Options button
 to display options for this pivot table.
The system displays a dialog box.
-
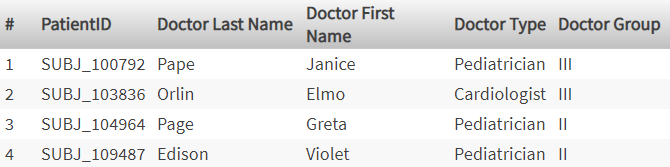
For the Listing drop-down list, click Doctor details and then click OK.
The Doctor details listing displays information about the primary care physicians for the selected patients.
-
Click the same cell that you clicked earlier and then click the Display Listing button
. Now the system displays something like the following: