
Hierarchies
Hierarchies
A dimension contains one or more hierarchies, each of which can contain multiple levels. The Model Contents area lists the levels in the order specified by the hierarchy, but (to save space) does not display the hierarchy names for this cube.
Users can take advantage of hierarchies to drill to lower levels. This part of the tutorial demonstrates how this works.
-
Click New.
-
Expand the BirthD dimension in the Model Contents pane. Drag and drop Decade to Rows.
Or double-click Decade.
The system displays something like the following:
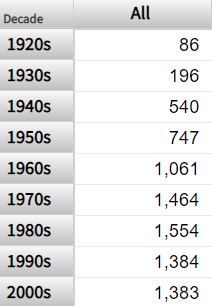
The measure shown is Count, which is a count of patients.
-
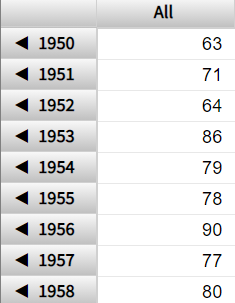
Double-click the 1950s row (or any other row with a comparatively large number of patients). Click anywhere to the right of the << symbols.
The system then displays the patients born in that decade, grouped by year (the next lowest level in the hierarchy), as follows:
This double-click behavior is available within pivot tables displayed on dashboards (not just within the Analyzer).
-
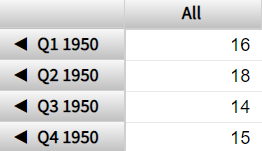
Double-click a row again. The system displays the patients born in that year, grouped by year and quarter:
-
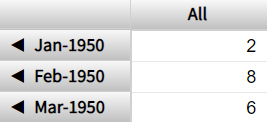
Double-click a row again. The system displays the patients born in that year and quarter, grouped by year and month:
-
Double-click a row again. The system displays the patients born in that year and month, grouped by actual date:
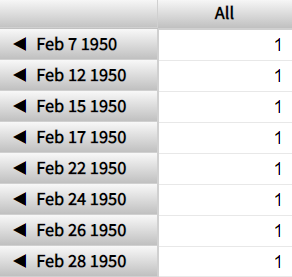
-
Click the << symbols repeatedly to return to the original state of the pivot table.