
Adding a Listing to the Cube
Adding a Listing to the Cube
A listing enables the users to see selected fields from the lowest-level data, which is useful in many scenarios. This information can help users identify outlier records or any records where follow-up activity might be needed.
-
First, let us examine the available fields in the Patients table.
-
Access the Management Portal and go to the namespace into which you installed the samples, as described earlier.
(If this is open on another browser tab, switch to that tab.)
-
Click System Explorer > SQL.
-
Click the Execute Query tab.
-
Execute the following query:
select * from bi_study.patientThis displays the first 1000 patients and shows the available fields.
-
Now try a query like the following:
select patientid, age,testscore,homecity->name as "City", primarycarephysician->lastname as "Doctor" from BI_Study.Patient -
Copy the query to Notepad or to any other convenient temporary location.
Leave this browser tab or window open for later use.
-
-
Add a listing that uses the fields in the query we just ran:
-
Access the Architect.
(If this is open on another browser tab, switch to that tab.)
-
Click Add Element.
-
For Enter New Element Name, type SampleListing.
-
Click Listing.
-
Click OK.
The system adds the listing.
-
In the Details pane, copy the list of fields from the earlier saved query to the Field list area, removing select as seen below:
patientid, age,testscore,homecity->name as "City", primarycarephysician->lastname as "Doctor"The system uses this list of fields and builds the SQL query.
-
Compile the cube.
When you do so, the Architect saves the cube.
You do not need to rebuild the cube.
-
-
Verify that you can access this listing in the Analyzer. To do so:
-
Access the Analyzer.
(If this is open on another browser tab, switch to that tab and click the Analytics > Analyzer link to refresh with the most current model.)
-
Click a cell in the pivot table already displayed in the preview area, or create a simple pivot table and click a cell in it.
-
Click the Display Listing button
 .
.The system displays something like the following:
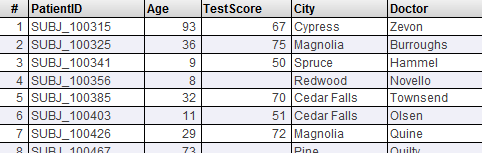 Note:
Note:The system displays the first 1000 records by default. You can change this within the Analyzer.
If you instead get a message that listings are not supported, make sure that you saved and recompiled the cube.
-
-
Modify the listing to sort the records in a different way:
-
Access the Architect again.
-
Click the listing in the Model Contents area.
-
In the Details pane, enter the following into Order By:
age,homecity->name -
Compile the cube.
When you do so, the Architect saves the cube.
-
-
Verify that the listing is now sorted by age, and then by city within age.
Display a listing as before. You should see something like this:
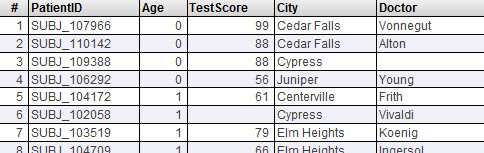
Scroll down to verify that patients are sorted by city within age.