
Examining the Initial Cube
Examining the Initial Cube
In this section, we examine the cube to see if there is anything we want to change.
To examine the cube, we will create simple pivot tables by dragging and dropping cube elements from the left area to the Pivot Builder area, which consists of the Rows area and the three boxes to its right.
The first thing to notice is that the Analyzer displays a measure (Count) that we did not define. This measure is provided automatically, and it counts the records in the base class.
Do the following to get acquainted with the new cube:
-
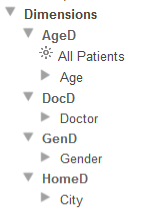
Click the triangle next to each dimension name in the left area.
When you are done, you should see the following:
-
Drag and drop the Age level to the Rows area. You should see something like this:

Notice that the members of this level are sorted as strings. For this level, it would be better to sort the members numerically, so we will have to make an adjustment.
-
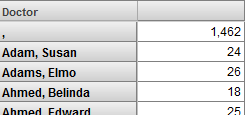
Drag and drop the Doctor level to the Rows area, placing it directly on Age. (In this action, you replace Age with Doctor.) Now you should see something like this:
 Note:
Note:Unlike the other dimensions created here, the Doctor dimension can have a very large number of members, depending on the size of your data set. In a real-world implementation, it is unlikely that you would create a dimension at such a low level. This tutorial uses this dimension to demonstrate a couple of key points.
The doctor name , refers to patients who do not have a recorded primary care physician (for these patients, both the last name and first name are null for the PrimaryCarePhysician field). We will change this when we redefine this level in the next part of the tutorial.
Whenever you create a level that is based on an identifier, it is important to consider whether that identifier is unique. In many cases (product names, procedure codes, department names, and so on), the identifier is unique. However, it is not safe to assume that names of people are unique. Because we have based this level directly on the doctors’ names, the system combines any doctors that have the same name.
For example, some patients could have a doctor named Agnes Djakovic, represented as row 17 in the Doctor table, and some other patients could have a doctor with the same name, but who is represented as row 380 in the same table. The Doctor level would have a member named Agnes Djakovic that combines those patients.
In a later part of the tutorial, we will use a more robust approach.
-
Drag and drop the Gender level to the Rows area, placing it directly on top of Doctor. This action replaces the Doctor level with the Gender level. Now you should see something like this:
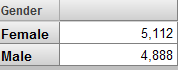
We will not need to make any changes to this level.
-
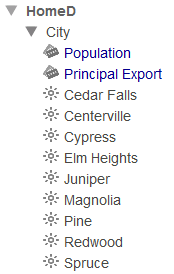
Expand the City level on the left. You should see this:
-
Drag and drop the City level to the Rows area, placing it directly on top of Gender. Now you should see something like this:
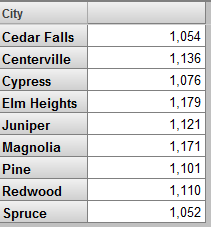
-
Drag and drop the Population and Principal Export properties to Columns. You should see this:
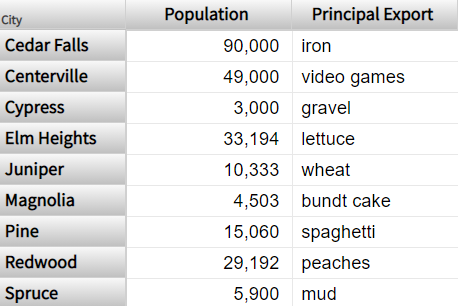
We will not need to make any changes to this level.