
Displaying a Production Business Metric
Displaying a Production Business Metric
This section discusses suitable ways to display production business metrics in charts. There are four general possibilities:
-
The metric defines only one instance (the default) and does not define AUTOHISTORY for any of the properties. In this case, when you display the metric as a pivot table, it appears with one row as follows:
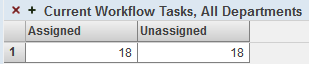
In this case, any kind of chart is suitable.
-
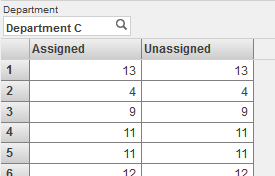
The metric defines multiple instances and does not define AUTOHISTORY for any of the properties. In this case, when you display the metric as a pivot table, it appears as follows:
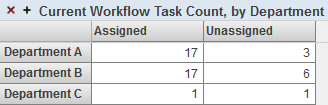
In this case, the most suitable chart types are bar and column charts and combo charts.
-
The metric defines only one instance (the default) and defines AUTOHISTORY for some or all of the properties. In this case, when you display the metric as a pivot table, it appears as follows:
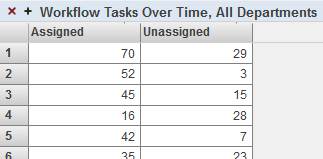
In this case, the most suitable chart types are bar and column charts, line charts, and combo charts.
Or, if a given property does not specify AUTOHISTORY, the column for that property is empty except for the last row. You might prefer to display only the properties that specify AUTOHISTORY. To do so, you can add a filter control and filter the data to show only those properties. Note that you can hide this control from the user.
-
The metric defines multiple instances and defines AUTOHISTORY for some or all of the properties. In this case, when you display the metric as a pivot table, the AUTOHISTORY is ignored by default, and the metric appears as follows:
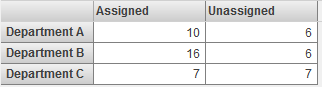
In this case, the most suitable chart types are bar and column charts and combo charts.
To force the metric to display the AUTOHISTORY, you can add a filter control and filter the data to show only one instance. Note that you can hide this control from the user. When filtered to display one instance, the metric appears as follows:
In this case, the most suitable chart types are bar and column charts, line charts, and combo charts.