
Defining Shared Dimensions and Compound Cubes
This page describes how to define shared dimensions and compound cubes for use in Business Intelligence.
You can define compound cubes in the Architect, but for shared dimensions, you must use an IDE.
For background information, see Summary of Model Options.
Also see Accessing the BI Samples.
Overview
This section provides an overview of shared dimensions and compound cubes.
Compound Cubes
A compound cube is a subject area that combines multiple cubes (typically two). For these cubes, any dimensions that have the same name must be formally shared dimensions. This enables you to create pivot tables that contain elements from multiple cubes.
The following shows a pivot table created from a compound cube:
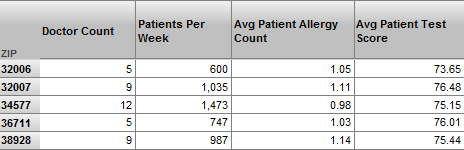
In this pivot table:
-
The Doctor Count measure and the Patients Per Week measure come from the Doctors cube.
The Patients Per Week measure is the number of patients seen per week by the given set of doctors.
-
The Avg Patient Allergy Count measure and the Avg Patient Test Score measure come from the Patients cube.
The CompoundCube subject area defines overrides so that these measures have different names than in that cube.
-
The ZIP level is in a shared dimension used by both of these cubes.
In a compound cube, the available dimensions are the dimensions from the first listed cube and all formally shared dimensions. The available measures include all the measures from all the cubes. The following rules apply:
-
For any measure that has the same name in all cubes used in the compound cubes, that measure becomes a common measure. For this measure, values are aggregated across all the cubes. For example, suppose that one cube is Employees and another cube is Patients. If both cubes have a Count measure, those counts are aggregated together.
The system provides an option for renaming the Count measure so that you can prevent this from occurring when it is not appropriate.
-
For any measure that exists only in one cube, it is treated as usual.
-
For any level that is formally shared, you can use members of that level with any of the cubes to select subsets of their records. In the example shown previously, the 32006 member corresponds to all doctors that have this ZIP code and all patients that have this ZIP code.
This fact means that the measures of all the cubes can potentially have different values for members of such a level. For example, the measure Patients Per Week (which is specific to doctors) and the measure Avg Patient Allergy Count (which is specific to patients) have different values for each ZIP code.
-
For any level that is not formally shared, a member of that level selects a subset of the records from the cube that owns it, but selects all records from the other cube.
This fact means that measures from the cube that define this level can potentially have different values for members of such a level, but measures from the other cubes always have the same value. In the following example, the Doctor Type dimension is not shared:
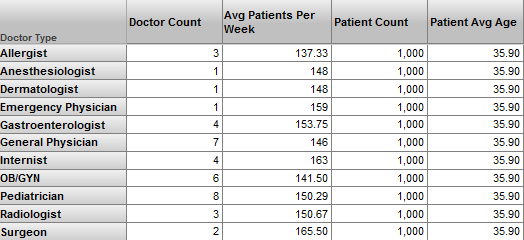
Note that the Doctor Count and Avg Patients Per Week measures (both of which are specific to doctors) have different values for each doctor type.
The other measures are specific to patients. They have the same value for each doctor type; this is the value aggregated across all patients.
Defining Compound Cubes
To create compound cubes, you must use an IDE. To create a compound cube, do all the following:
-
Create a subject area with the Base cube option equal to a comma-separated list of cubes. For example, for the sample subject area CompoundCube/CompoundCube, Base cube is as follows:
CompoundCube/Patients,CompoundCube/Doctors,CompoundCube/CityRainfallAlso edit the Depends On option in the Details Area on the right. For the value, specify the full package and class name of all the cube classes.
Any subject area class should always be compiled after the cube class or classes on which it is based. The Depends On setting helps control this.
-
In the cubes that the compound cube uses, optionally redefine the Count measure. To do so, specify the countMeasureName and (optionally) countMeasureCaption attributes in the definitions of the cubes. For example:
<cube xmlns="http://www.intersystems.com/deepsee"
name="Doctors"
displayName="Doctors"
sourceClass="BI.Study.Doctor"
countMeasureName="DoctorCount"
countMeasureCaption="Doctor Count">
...
This change does not require rebuilding these cubes.
-
In the compound cube, optionally change the display names of measures names to be more specific, for use in the compound cube. For example:
<subjectArea xmlns="http://www.intersystems.com/deepsee/subjectarea"
name="CompoundCube" displayName="CompoundCube"
baseCube="Doctors,Patients">

<measure name="Allergy Count" displayName="Patient Allergy Count"/>
<measure name="Avg Allergy Count" displayName="Patient Avg Allergy Count"/>
<measure name="Age" displayName="Patient Age"/>
<measure name="Avg Age" displayName="Patient Avg Age"/>
<measure name="Test Score" displayName="Patient Test Score"/>
<measure name="Avg Test Score" displayName="Patient Avg Test Score"/>
<measure name="Encounter Count" displayName="Patient Encounter Count"/>
<measure name="Avg Enc Count" displayName="Patient Avg Enc Count"/>

</subjectArea>
Recompile any cube definitions that you change. Recompile the compound cube last.
In a compound cube, the available dimensions are the dimensions from the first listed cube and all formally shared dimensions. The available measures include all the measures from all the cubes.
Any dimensions that have the same name in both cubes must be formally shared. Any measures that have the same name in both cubes are aggregated together.
Detail Listings for Compound Cubes
To define detail listings for a compound cube, define identical detail listings in all the participating cubes. The system generates an SQL UNION of these listings.
Note that the listings must be directly based on SQL; detail listings via data connectors will not work for compound cubes.
Example Compound Cube
To see an example of a compound cube, see the class BI.Model.CompoundCube.CompoundCube. This class is defined as follows:
Class BI.Model.CompoundCube.CompoundCube Extends %DeepSee.SubjectArea
[ DependsOn = (BI.Model.CompoundCube.Patients, BI.Model.CompoundCube.Doctors,
BI.Model.CompoundCube.CityRainfall) ]
{

/// This XData definition defines the SubjectArea.
XData SubjectArea [ XMLNamespace = "http://www.intersystems.com/deepsee/subjectarea" ]
{
<subjectArea name="CompoundCube/CompoundCube"  displayName="CompoundCube/CompoundCube"
    baseCube="CompoundCube/Patients,CompoundCube/Doctors,CompoundCube/CityRainfall"  >
</subjectArea>
}

}
The cube CompoundCube/Patients, which is defined in BI.Model.CompoundCube.Patients defines all the dimensions.
The other cubes (CompoundCube/Doctors and CompoundCube/CityRainfall) define dimensions that are shared from the CompoundCube/Patients. Notice that not all the dimensions are defined in all the cubes. The following table shows the dimensions available in each cube:
| Dimension | CompoundCube/Patients cube | CompoundCube/Doctors cube | CompoundCube/CityRainfall cube |
|---|---|---|---|
| BirthD |  |
|
|
| DocD | |
|
|
| DocTypeD | |
|
|
| HomeD | |
|
|
The HomeD dimension is defined in all three cubes, so this dimension affects the measures of all three cubes. For example, the dashboard Demo Compound Cube includes this pivot table:
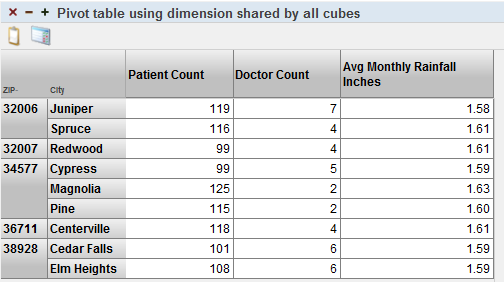
The Patient Count measure is defined in CompoundCube/Patients, Doctor Count measure is defined in CompoundCube/Doctors, and Avg Monthly Rainfall Inches measure is defined in CompoundCube/CityRainfall. Notice that the values are different for each measure for each city.
The same dashboard also includes a pivot table that use BirthD for rows:
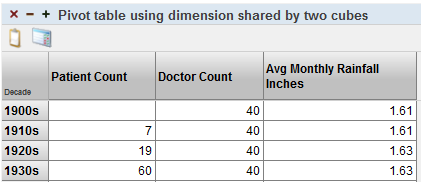
Because CompoundCube/Doctors does not define the BirthD dimension, the measure Doctor Count cannot be broken out by birth decade. Notice that the Doctor Count column shows the same number in all cells; this is the total doctor count across birth decades for all patients.
Finally the Demo Compound Cube dashboard also includes a pivot table that use DoctTypeD for rows:
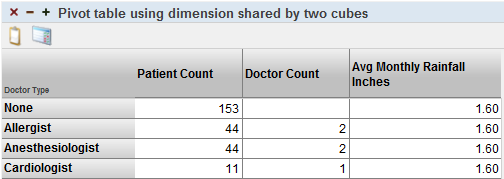
Because CompoundCube/CityRainfall does not define the DocTypeD dimension, the measure Avg Monthly Rainfall Inches cannot be broken out by doctor type. This measure is aggregated across all patients (by averaging, as defined in the measure).