
Introduction to the Production Configuration Page
To create and configure interoperability productions, you use the Production Configuration page, introduced here.
For information on the legacy Production Configuration page, see Introduction to the Legacy Production Configuration Page.
Displaying the Production Configuration Page
To display the Production Configuration page:
-
Log in to the Management Portal.
-
Switch to the namespace you want to work in.
If you are not already in an interoperability-enabled namespace, choose your working namespace from the available interoperability-enabled namespaces.
-
Click Interoperability > Configure > Production.
-
Click Try the new UI.
Within this new integrated application, the left upper area has buttons that enable you to open the new Production Configuration editor, the Rule Editor, and the Data Transformation Editor, as stacked panels in the same window. Below the buttons, the left area contains the following collapsible groups, to enable you to select items to view or work on:
-
Productions, which lists all the productions in the current namespace. Only one can be selected at a time.
-
Production Items, which lists all the business hosts in the currently selected production. This group includes additional subgroups: Inbound Hosts (for business services), Process Hosts (for business processes), and Outbound Hosts (for business operations).
To search for production items by name, type a name or part of a name into the Filter Items box to filter these lists.
-
Rule Sets, which lists all the rule sets in the current namespace.
When you select a rule set, the application displays it within the Rule Editor.
-
Data Transformations, which lists all the data transformations in the current namespace (both DTL transformations and custom transformations).
When you select a DTL transformation, the application displays it within the DTL Editor. (Custom data transformations must be edited in an IDE.)
-
Business Process, which lists all the business processes in the current namespace (both BPL business processes and custom business processes).
When you select a BPL business process, the application displays it within the BPL Editor. (Custom business processes must be edited in an IDE.)
The new Production Configuration page provides major new features, including the following:
-
Split panel view: While looking at a production, you can open other screens in a separate split panel.
-
Enhanced filtering: The search box at the top of the Production Configuration page enables you to search across all items listed in the left area.
-
Expandable routers: Routers can be expanded to view rules, transformations and connections inline.
-
Reworked host connections: Direct and indirect connections are now rendered when a business host is selected, allowing you to see the full path a message can take.
Filtering and Sorting the Display
To filter the business hosts in the production diagram, type a string into the filter box above the diagram:

As you do so, the page displays a drop-down list of items that have names or categories matching the text you entered.
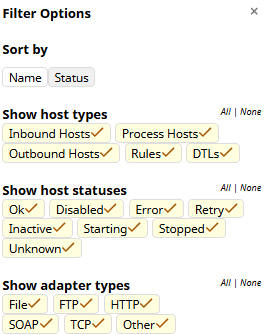
Another option is to click the Filter button at the right side of the filter box. This displays the following options
Hiding or Showing the Settings Pane
Click the Settings icon ![]() to hide or show the production or business host settings on the right side of the page.
to hide or show the production or business host settings on the right side of the page.
Accessing Management Options
The Settings window includes links that provide easy access to management options.
These management tabs are as follows:
-
Queue > Go to Queues—Click to view a list of the queues related to this production or business host.
-
Log > Go to Event Log—Click to view an abbreviated list of Event Log entries for this production or business host.
-
Messages > Go to Message Viewer—Click to display the Message Viewer to see messages processed by this production or business host.
-
Jobs > Go to Jobs—Click to view jobs related to this production or business host.
Each of these links opens in a new browser tab with more information; see Managing Productions.